Unleash the power of Google Analytics
No need to waste time and money creating your own analytic system or relying on generic efforts. You can use the power of Google, combined with Door Tablet, to deeply understand how your workspaces are being used. This knowledge gives you the power to make the workspace management changes necessary to increase workspace and meeting efficiency, saving you time and money.
Is my data still secure?
Google do not access your data. We built Door Tablet with security in mind, not as a mere afterthought. Door Tablet runs only on your premises or in your private cloud, so you have complete security control of the system. Just as we do not have access to our customer’s data at all, nor will Google.
Analytics does not mean a compromise to security. You maintain the same level of privacy and safety while enjoying full analytics features.
What reports can I generate?
Combining Door Tablet with UA gives you easy and instant access to daily, weekly, monthly, annual or “any-interval-you-want” reports including:
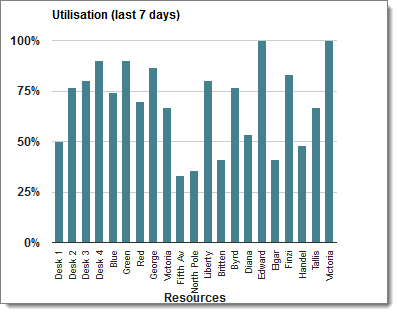
- What proportion of the time a workspace is used
- How many meetings get cancelled, never start or over run
- The duration of meetings
- The time of day meetings start and end
- Who is using what room (may have security/authorisation implications)
- The usage of each workspace over days, weeks, months or years
- The usage of workspaces by area – define your areas by work zones, floors, buildings, cities, regions, countries and continents
- Usage comparisons over time, month on month, season to season and year on year
Armed with these reports, you can investigate the underlying reasons behind usage patterns and transform the way you use workspaces and manage meetings.
What value are the reports?
Using Door Tablet, you have the assurance that any issue with workspace usage is not due to problems with the system used for booking rooms or meetings. The issues therefore lie in the users’ behaviours or the workspace itself, which you can then investigate.
A problem with rooms
Take the example of a company with five meeting rooms, and reports indicate that Room 3 is hardly used. A simple explanation may be that the company only needs four rooms, and it can release or repurpose room 3 for big cost savings. However, the reports do indicate there is sufficient demand for Room 3 since the other four rooms are under great pressure. The problem therefore must lie with Room 3 itself and this is what you can investigate. For example, it may be a problem with:
- Room Environment: too hot, too cold, too stuffy, too gloomy, too smelly, too noisy
- Room Geography: too far away, elevator to it never works
- Room Size: too big, too small, awkward shape
- Room Facilities: lacking equipment, equipment does not reliably work
- Users: people never use room 3 out of habit, they didn’t realise it had certain equipment
By surveying the users, you can find out why the room is underused and quickly address the issues.

See more reports here
A problem with meetings
Analytics will also reveal the problems with meetings themselves. Are they routinely overrunning? Underattended? Always being cancelled? Over too quickly, suggesting perhaps they were never needed?
There is a whole industry dedicated to ensuring meetings achieve their aims and by using Door Tablet, you will be able to identify exactly what type of help you may need.
How does it work?
In simple terms, every time a workspace is used (e.g. the user taps in or out via the touchscreen or RFID/NFC), the Door Tablet system is aware of it. It collects this information (called a “hit”) to the UA by HTTP or HTTPS. Different events generate different types of hits. If the workspace was booked but no one turns up, then this is a different type of hit event. All these different hits are sent to your account which is visible exclusively to you – not to us and not to Google.
As Door Tablet starts to post these different hits to Google Universal Analytics (UA), usage reports can be generated in a variety of ways.
UA Reporting
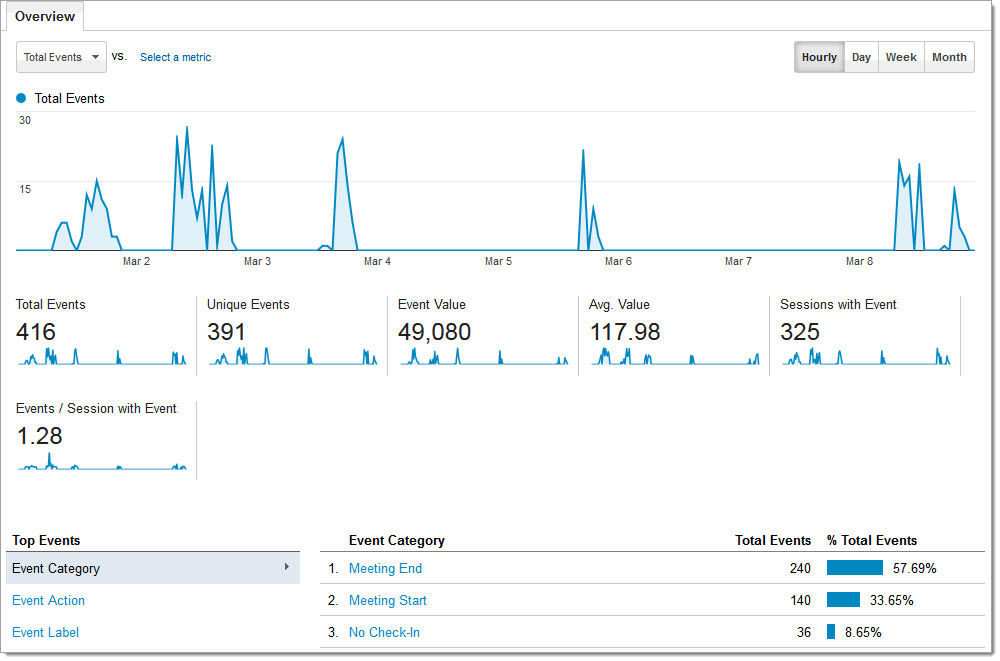
The built-in reporting is both rich in functionality and easy to use.

Sample event report
You can access these UGA tools from here.
Google Analytics Spreadsheet Add-on
The Google Analytics Spreadsheet add-on makes it even easier for Door Tablet users to access, visualize, share, and manipulate their data in Google Spreadsheets. The add-on gives you the full power of Google Analytics Core and Multi-Channel Funnels Reporting APIs without requiring you to know or write any code.
Configuration Tasks
See how to configure Door Tablet for use with UA here
See how to configure UA for use with Door Tablet here
See sample reports here
See more information on our room booking and scheduling software here.