n
anonymousdoortablet/dthelp.nsfua-reports
Protected content
| 263pages | Our help system contains many pages and videos for you to consume. This includes the complete information on how Door Tablet works, all its features and options, and of course the many benefits for your business. Door Tablet School offers many videos too. |
|
 |
| 
Click on images to see them in full screen
CF16469B53CA161A80257E03005DB46EUA Reports
Once the Door Tablet Add-in starts to post hits to Google Universal Analytics (UA), reports can be generated in a variety of ways, using a variety of tools.
Built-in UA Reporting
The built-in reporting is both rich in functionality and easy to use.
Notes:
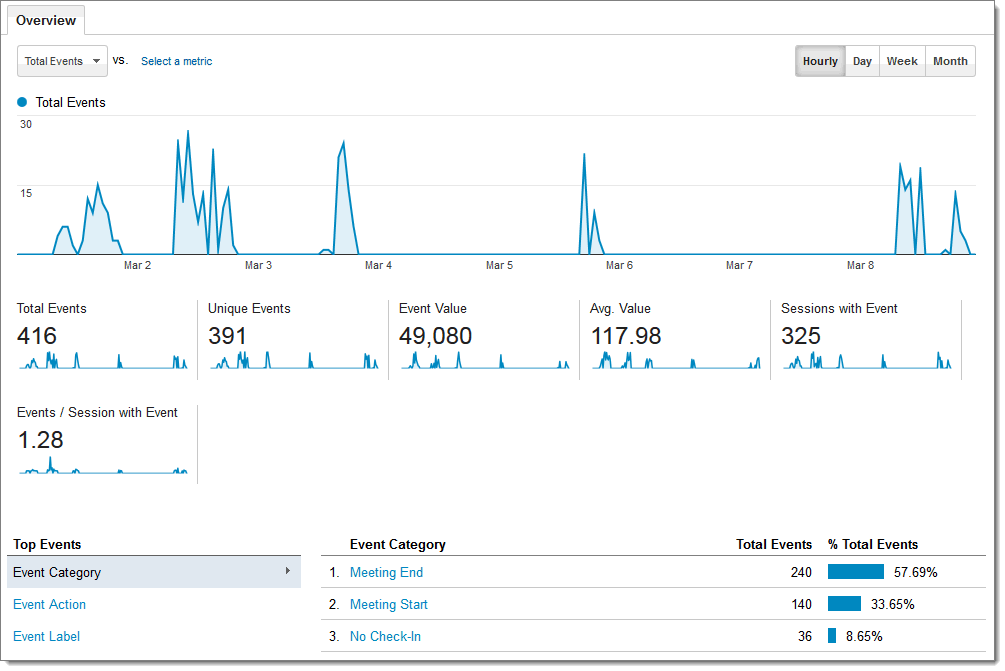
- Meeting starts and ends are posted as "event" hits. Starts and Ends would be identical in number (please ignore the discrepancy below as we started with ends only).
- End of Day (EOD) reports are posted as "pageview" hits.
Access Events and Pages:
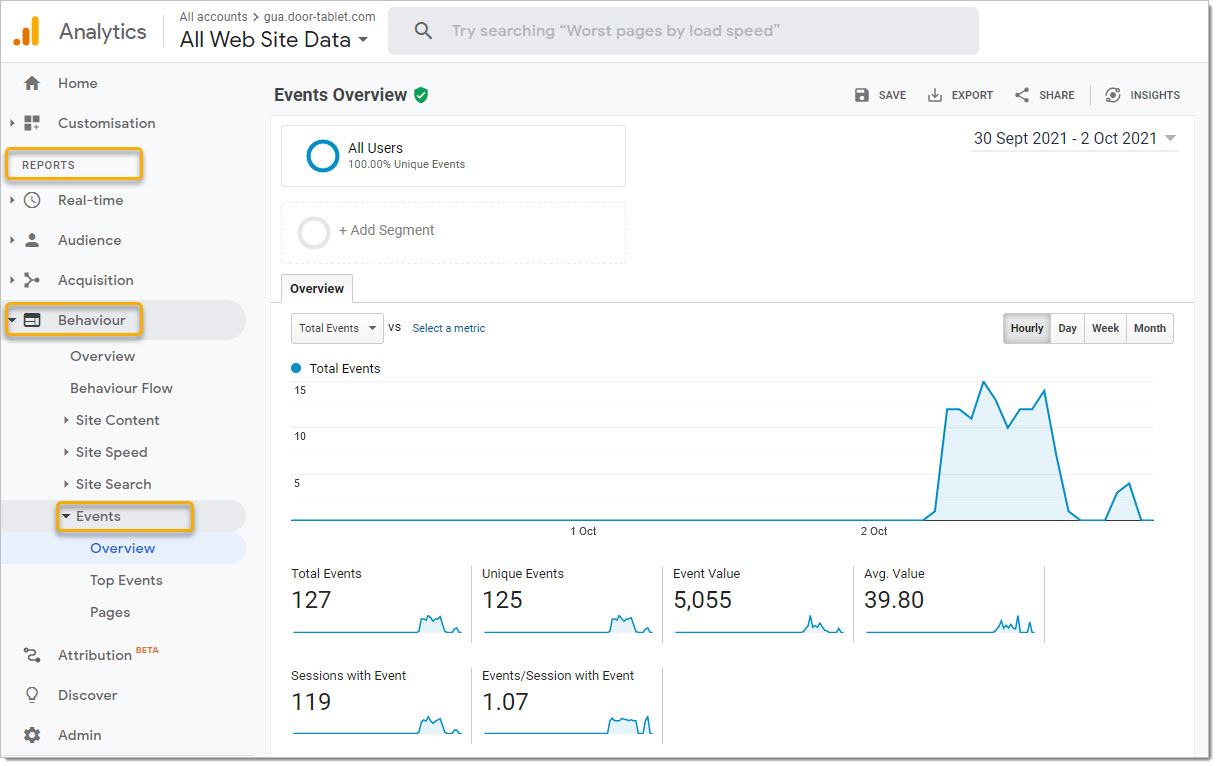 Sample events report:
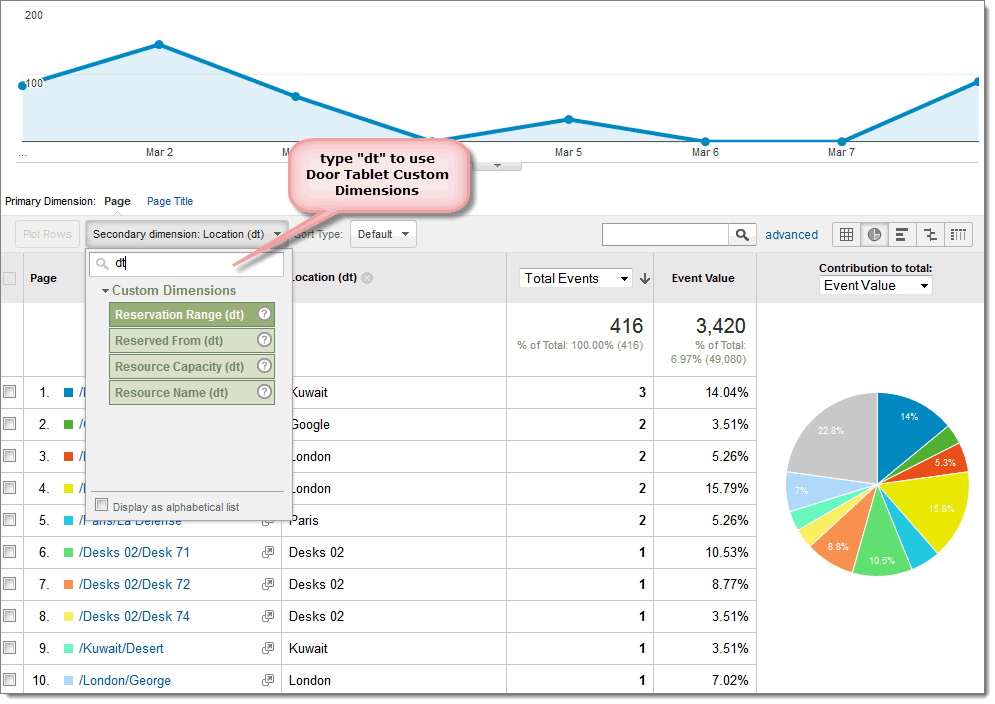
 Using EOD with pages
When looking at End of Day (EOD) reports use the Pages reports:
 When picking Custom Dimensions, use the letters "dt" to access the ones you defined.
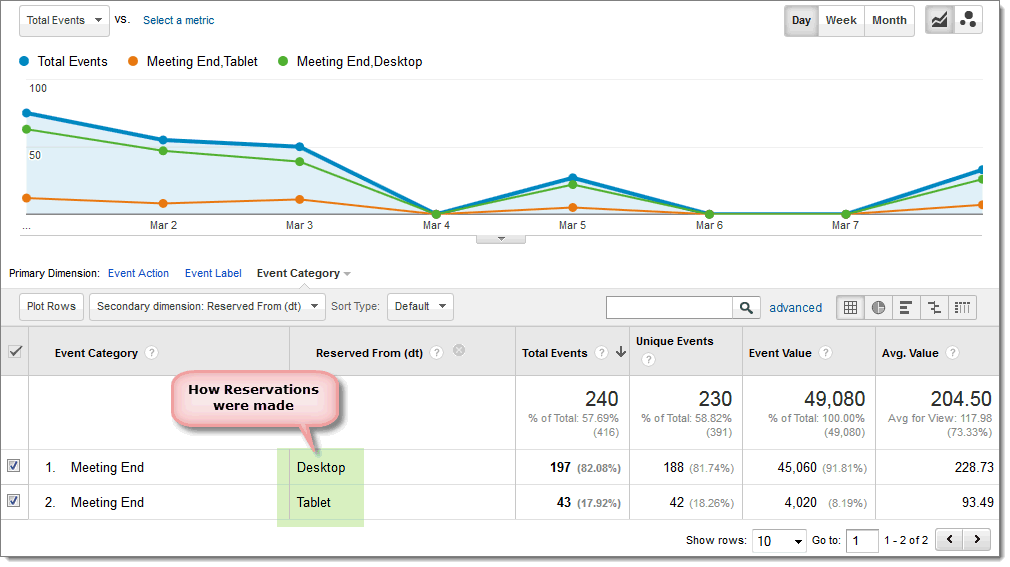
 Reserved from report:
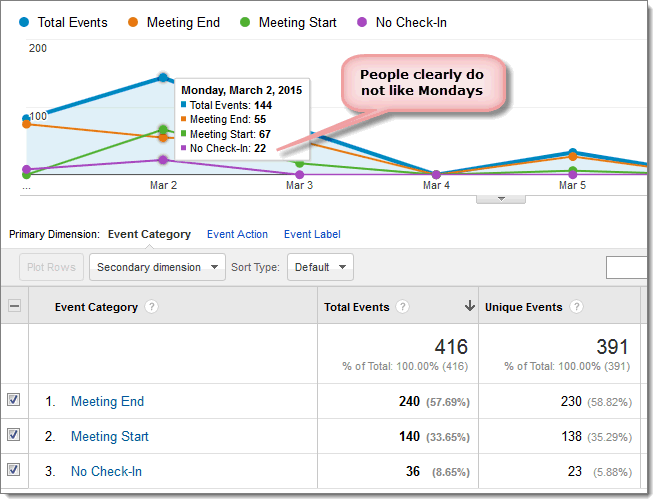
 Check how many meetings failed... (remember that every meeting has two events, so in the report below 11 meeting were aborted)
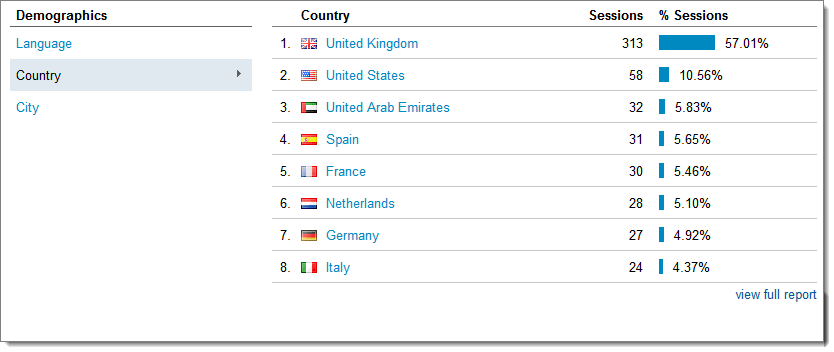
 View where meetings take place (1 session = 1 meeting):
 Report using other tools
Google UA offers additional rich tools at your disposal. Some of these tool will be embedded in the Door Tablet Web UI in order to provide instant access which will require no effort for end users. You can access these tools from here https://ga-dev-tools.appspot.com/embed-api/
Example
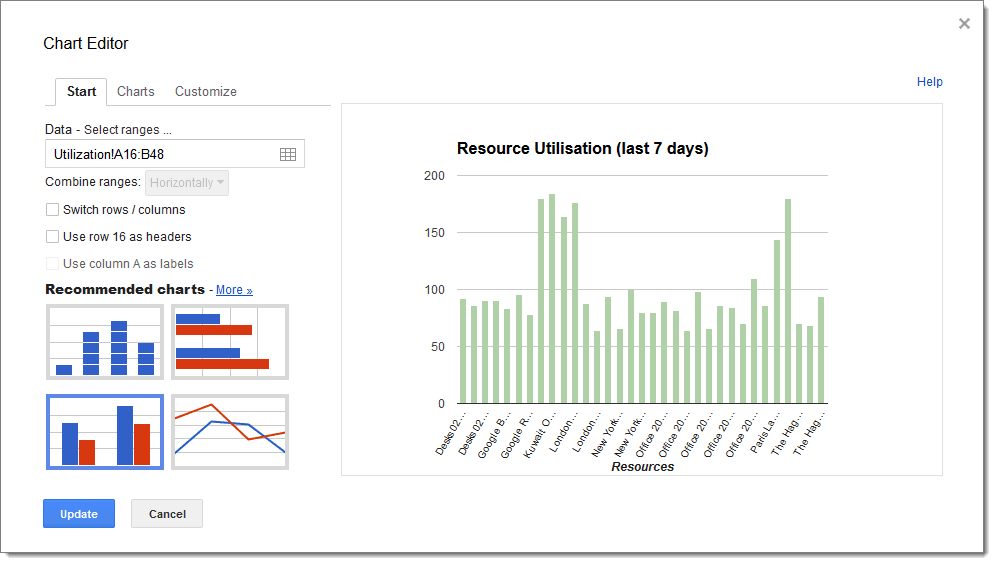
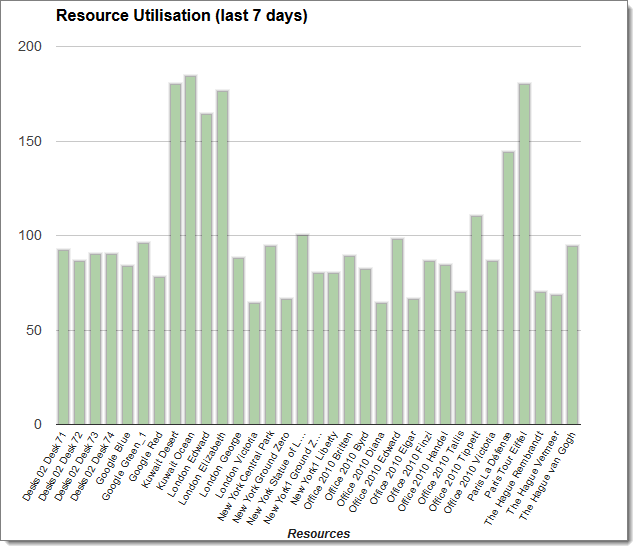
The following demonstrates how you get the Resource Utilisation report in a matter of minutes.
This is showing how much each resource is actually used, based on its time availability:
 Follow the steps:
During the process of accessing the tools you will be asked to authenticate to Google and approve access to your Analytics Account and properties.
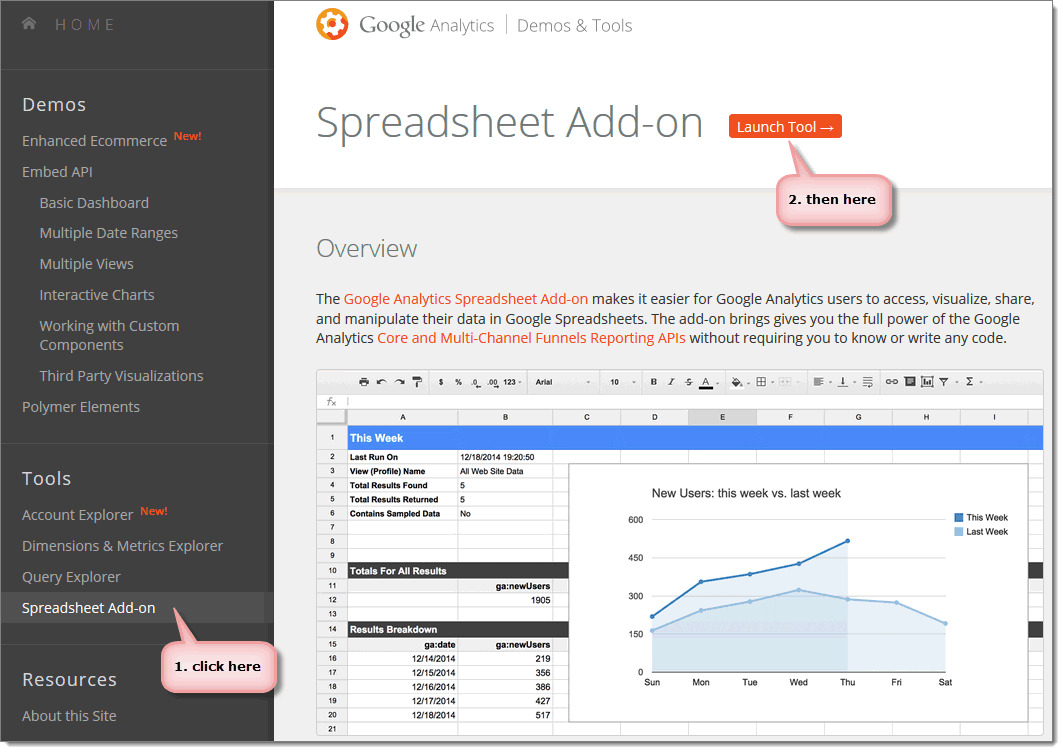
Open the above URL and click on "Spreadsheet Add-on" and then "Launch Tool".
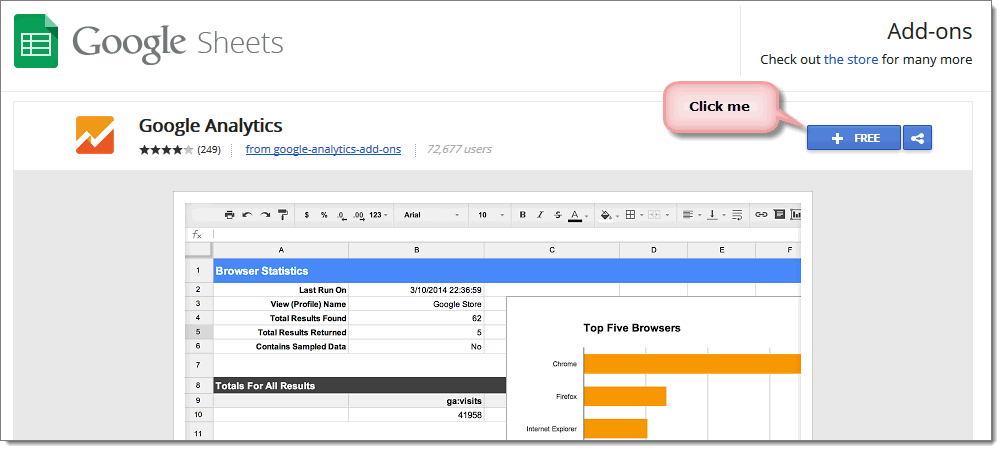
 Then click "+ FREE":
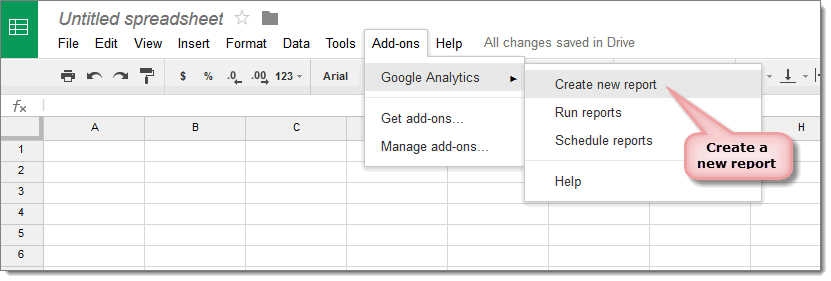
 The spreadsheet will appear, click on "Create new report":
 Fill in this form as follows:
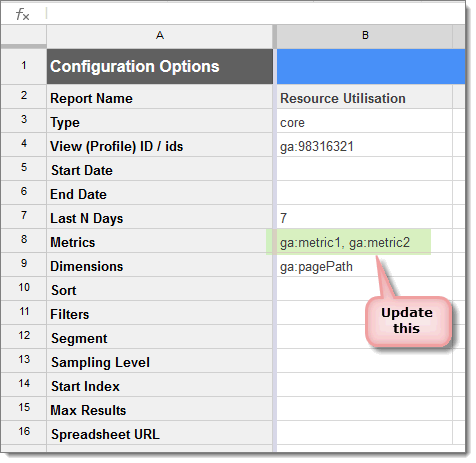
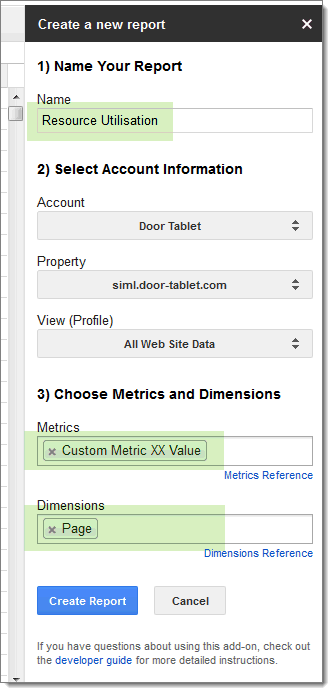 You will now need to make a small addition to the report parameters. Add the two metrics exactly as shown below, using a comma to separate them:
 You are now ready to run the report, click "Run reports":

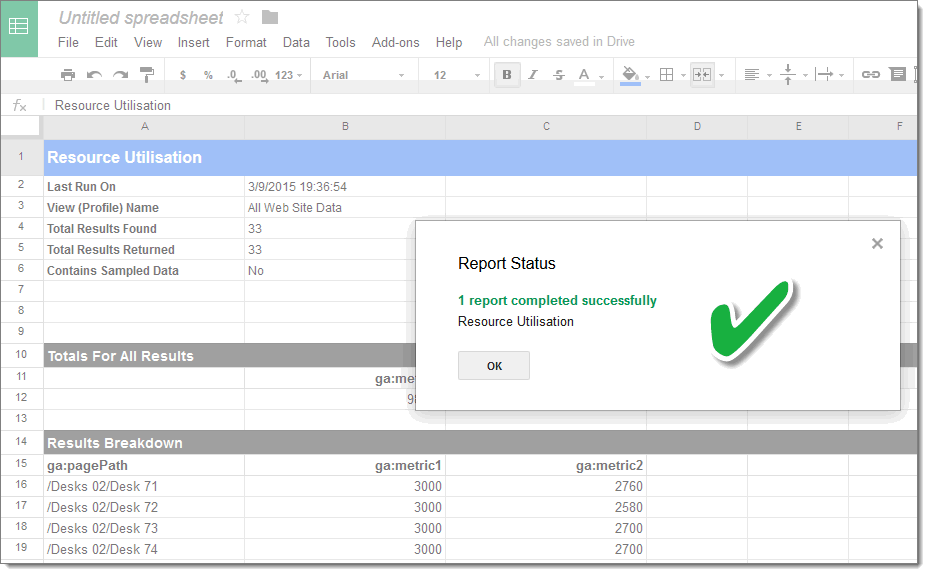 You are now able to manipulate the results. For example, calculating the ratio between the used minutes and available minutes. Add a column between the resource names and the total available time, and insert the formula as shown:
 Copy the formula for all the resources and you will now have a column that is ready to plot in a chart:
